
FactNinja is a tool for analyzing visual content such as posters, memes, social media communication screenshots, photos with text, propaganda materials, political advertising campaigns, or other types of digital visuals. After uploading an image, the system runs a set of specialized analyses that complement each other and together provide a comprehensive view of the examined content.
Each analysis focuses on a different aspect of the graphic material. For example, the system identifies text contained in the image, evaluates what emotions, attitudes, or opinions the material tries to evoke in the audience, recognizes verifiable claims suitable for fact-checking, assesses the likelihood of using generative artificial intelligence in content creation, evaluates the credibility and potentially misleading nature of the message, and detects any manipulative or persuasive techniques. The analysis also includes uncovering available metadata, for example through EXIF analysis, and assessing possible image manipulation, for example based on changes in compression in JPG files.
This multilayered approach is intentional. A simple verdict like "true" or "false" could be misleading: propaganda often works with true statements set in a manipulative framework, while even honest communication may contain inaccurate or clumsy formulations. Instead of a definitive conclusion, we offer a breakdown of the content into individual layers that the user can assemble into their own judgment.
This text explains how our tools work inside: what scientific principles they are based on, what their strengths are, and where their limits lie.
What Happens When You Upload an Image for Analysis
The moment you click on Analyze, the system launches a cascade of independent tasks in the background. Each addresses one aspect of the image and runs independently — the failure of one layer does not significantly affect the others. For example, if text recognition technically fails on a very stylized meme, the main analysis and emotional breakdown continue. The entire cascade typically takes several tens of seconds to a few minutes — depending on the complexity of the image and the load on AI services. While waiting, you see live indicators of what is currently happening.
Assistants and Analysis Perspectives
When selecting an assistant for analysis, you are not primarily choosing between different large language models (LLM), but between different analytical roles and perspectives. Each assistant is defined by a different set of instructions that determine its priorities, way of interpreting content, and aspects it focuses on during analysis. The model represents the "engine" of the analysis, while the assistant determines how this engine will be used in evaluating the image.
The default FactNinja assistant offers a balanced view and goes through key aspects of the analysis. Other assistants have their own specializations and focuses, which are described directly in the application when selecting them.
The same image analyzed by different assistants may therefore lead to different emphases — and this is intentional, not a mistake. A visual material can be legitimately interpreted from multiple angles, and its effect can vary significantly depending on the audience, cultural context, or personal attitudes of the recipient.
For example, black humor may evoke amusement, joy, or a sense of belonging in one group, while in another group it may provoke anger, disgust, or indignation, especially if it sympathizes with the person or group being caricatured. Both reactions can be legitimate and reflect how diversely people perceive the same content. Such diversity of interpretations is a natural part of human communication and does not in itself represent an error in analysis.
The Visual Insights panel summarizes the current views on the analyzed material, but its main function is to explain what emotions, attitudes, and reactions the content may be trying to evoke in the audience. It is therefore not just a summary of previous analyses, but an independent interpretative layer that helps understand the psychological and communicative impact of the visual.
This section is based on several scientific models of working with emotions and media influence, which we will explain in more detail later in the text. Thanks to this, the same material can be viewed not only in terms of factual accuracy but also in terms of how it affects different audience groups.
How FactNinja Analyzes Graphic Materials
FactNinja uses several types of artificial intelligence tools to analyze visual content. The basis is multimodal language models capable of working with both image and text, currently especially the GPT-5 and GPT-5-nano models from OpenAI. These models can read text in an image, describe visual elements, recognize relationships between them, and interpret content in natural language.
For example, if the system analyzes a poster with Lenin, it is not only about recognizing a famous face. The model also observes the style of graphics, typography, color scheme, composition, rhetorical elements, and historical context. It can thus identify references to Soviet constructivism, propaganda language, or visual patterns typical of certain political or ideological materials.
The analysis also includes specialized tools, such as Google Vision AI and Google Fact Check tools. They help complement the linguistic interpretation with technical and contextual information: they can, for example, recognize objects and text in the image, search for occurrences of similar or identical images on the internet, determine when and where the image appeared, and verify whether it has already been evaluated in the past as false, misleading, or related to fake news.
However, it is important to emphasize that AI does not "see" the image in the same way a human does. It does not have its own experience, intuition, or cultural sensitivity in the human sense. It works with learned patterns and connections that it has developed during training on extensive sets of text and image data. Thanks to this, it can recognize recurring visual, linguistic, and semantic patterns, but it is not infallible.
Sometimes the system may attribute a meaning to an image that is not actually there. Other times it may overlook a small detail, cultural reference, irony, or local context that a human observer would immediately capture. Therefore, it is necessary to understand the output of the analysis as a qualified interpretation, not as a definitive verdict.
⚠ Key Principle: FactNinja is an analytical assistant, not a judge. Its outputs are intended to serve as a starting point for your own critical thinking. That is why we combine multiple analytical perspectives, scientific models, and transparent methodology: to provide the user with enough background to form their own informed judgment.
In addition to the main text analysis, FactNinja also returns a structured output of key elements of the analyzed materials. This is important because it allows for further work with the results: displaying them in visualizations, such as graphs, maps, or overview diagrams, filtering them by categories, and using them for further analytical processing.
Structured data captures several key layers of analysis. Key topics represent a list of elements that the system recognized in the image — from specific objects and people to visual styles to abstract concepts, ideological frameworks, or communication motifs.
Verifiable claims are specific statements that can be independently verified using available sources. Each claim can be marked with a status, such as true, partially true, false, misleading, or unverifiable. This layer helps separate the factual level of the message from its emotional or rhetorical impact.
Detected logical fallacies indicate argumentative errors or problematic ways of persuasion that may appear in the material. They are linked to our glossary of logical fallacies, making it easy to explain, compare, and place individual techniques in a broader context of media literacy.
The structured output also includes a lay summary — a short and understandable explanation intended for someone who does not know the broader context of the analyzed material. Its goal is to quickly convey what the image is about, what message it likely conveys, and why it may be relevant.
Visual Insights: Mapping Emotional Impact
Visual Insights is one of FactNinja's main features. It deserves a separate explanation because it is not just based on a loose interpretation of the image but is based on scientific models used in psychology of emotions and media analysis. These models help describe what emotions, attitudes, and reactions the visual material may be trying to evoke in the audience.
You can access the Visual Insights feature from any analysis via the Visual Insights button, which opens a separate page with the emotional profile of the analyzed material.
🎯 Key Principle: Visual Insights does not say what you personally feel. It describes what emotional effect the material is likely trying to evoke. The same poster may evoke pride in one viewer, while in another, it may evoke disgust or anger. The analysis therefore does not focus on the individual reaction of a specific person but on the likely communicative intent and emotional construction of the material.
Plutchik's Wheel of Emotions
One of the models that Visual Insights is based on is Plutchik's Wheel of Emotions. American psychologist Robert Plutchik introduced the psychoevolutionary theory of emotions in 1980, according to which emotions are not just cultural constructs but deeply rooted reactions that evolved as part of human survival.
Fear, for example, alerts us to danger, anger mobilizes energy for defense or resistance, joy supports social bonds, and trust enables cooperation. Plutchik distinguished eight basic emotions, from which, according to his model, more complex emotional states are composed, similar to how colors are composed of several basic shades.
He arranged these emotions in a circle: emotions that are adjacent have a close meaning, while emotions placed opposite each other form opposites. This model allows for a better description of whether the material works, for example, with fear, anger, disgust, trust, joy, or their combinations.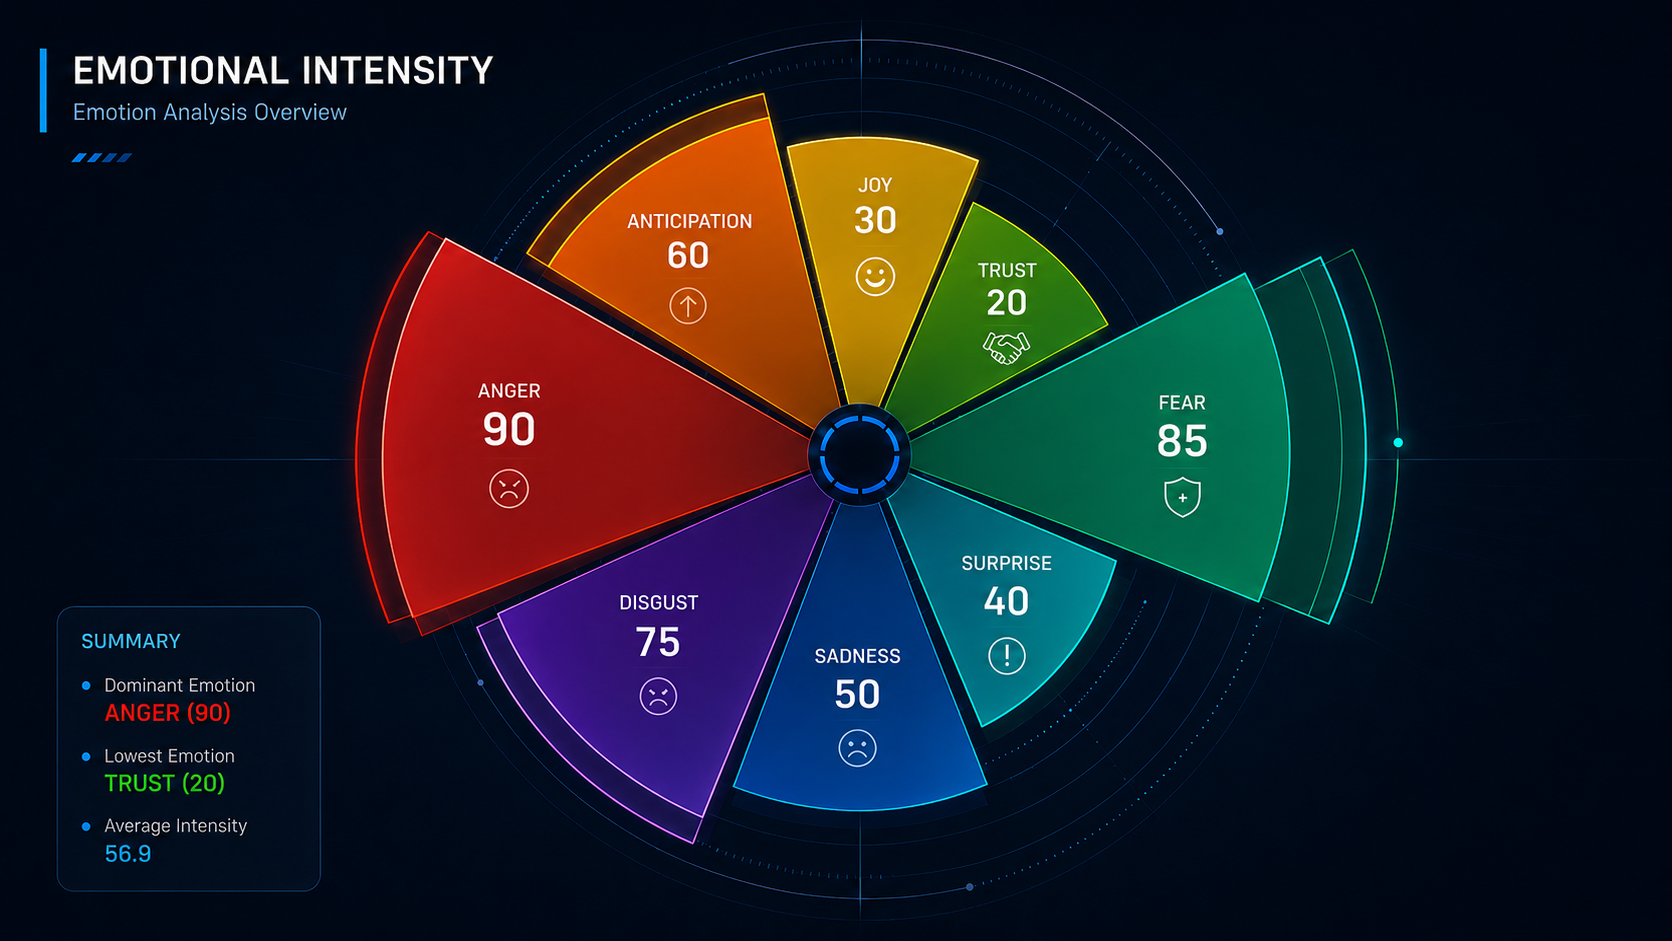
In the application, for each of the eight emotions, we indicate intensity on a scale of 0 to 100, depending on how strongly the material evokes this emotion. In the Plutchik wheel graph, this is displayed as a "blooming flower" — the longer the petal of a certain color, the stronger the emotional appeal of that type. A heroized portrait of a leader with a flag typically shows high values of joy, trust, and anticipation. A poster warning against the enemy shows strong fear, disgust, and anger (as in the illustration above).
Dyads — Compound Emotions
Plutchik's theory also works with combinations of basic emotions. If two adjacent emotions in his model are connected, so-called dyads are created — compound emotional states with their own meaning.
For example, joy combined with trust creates love, fear combined with surprise can lead to awe, sadness with disgust creates regret, and anger combined with anticipation can be related to aggressiveness.
The Dyads section in Visual Insights shows which of these emotional combinations are strongest in the analyzed material. These compound emotions often better capture the communicative intent than the basic emotions alone. The material usually does not work with just one isolated emotion but with their combination: for example, with fear and anticipation, anger and disgust, or joy and trust.
Russell's Model — Valence and Activation
The second scientific basis for Visual Insights is Russell's model of emotions, also published in 1980. American psychologist James A. Russell proposed that emotions can be described using two basic dimensions: valence and activation.
Valence expresses whether the emotional experience is more pleasant or unpleasant. For example, joy, trust, or hope have positive valence, while fear, anger, or disgust have negative valence.
Activation indicates the level of internal arousal or mobilization. Some emotions are calmer and more subdued, such as sadness or trust. Others are highly activating — such as anger, fear, panic, or excitement. This dimension is especially important for propaganda and political materials, which often aim not only to convey information but to mobilize the audience to a certain stance or action.
Russell's model thus helps distinguish not only whether the material has a positive or negative effect but also whether it calms or activates the viewer. The combination of valence and activation allows for a better understanding of the emotional strategy of the analyzed visual.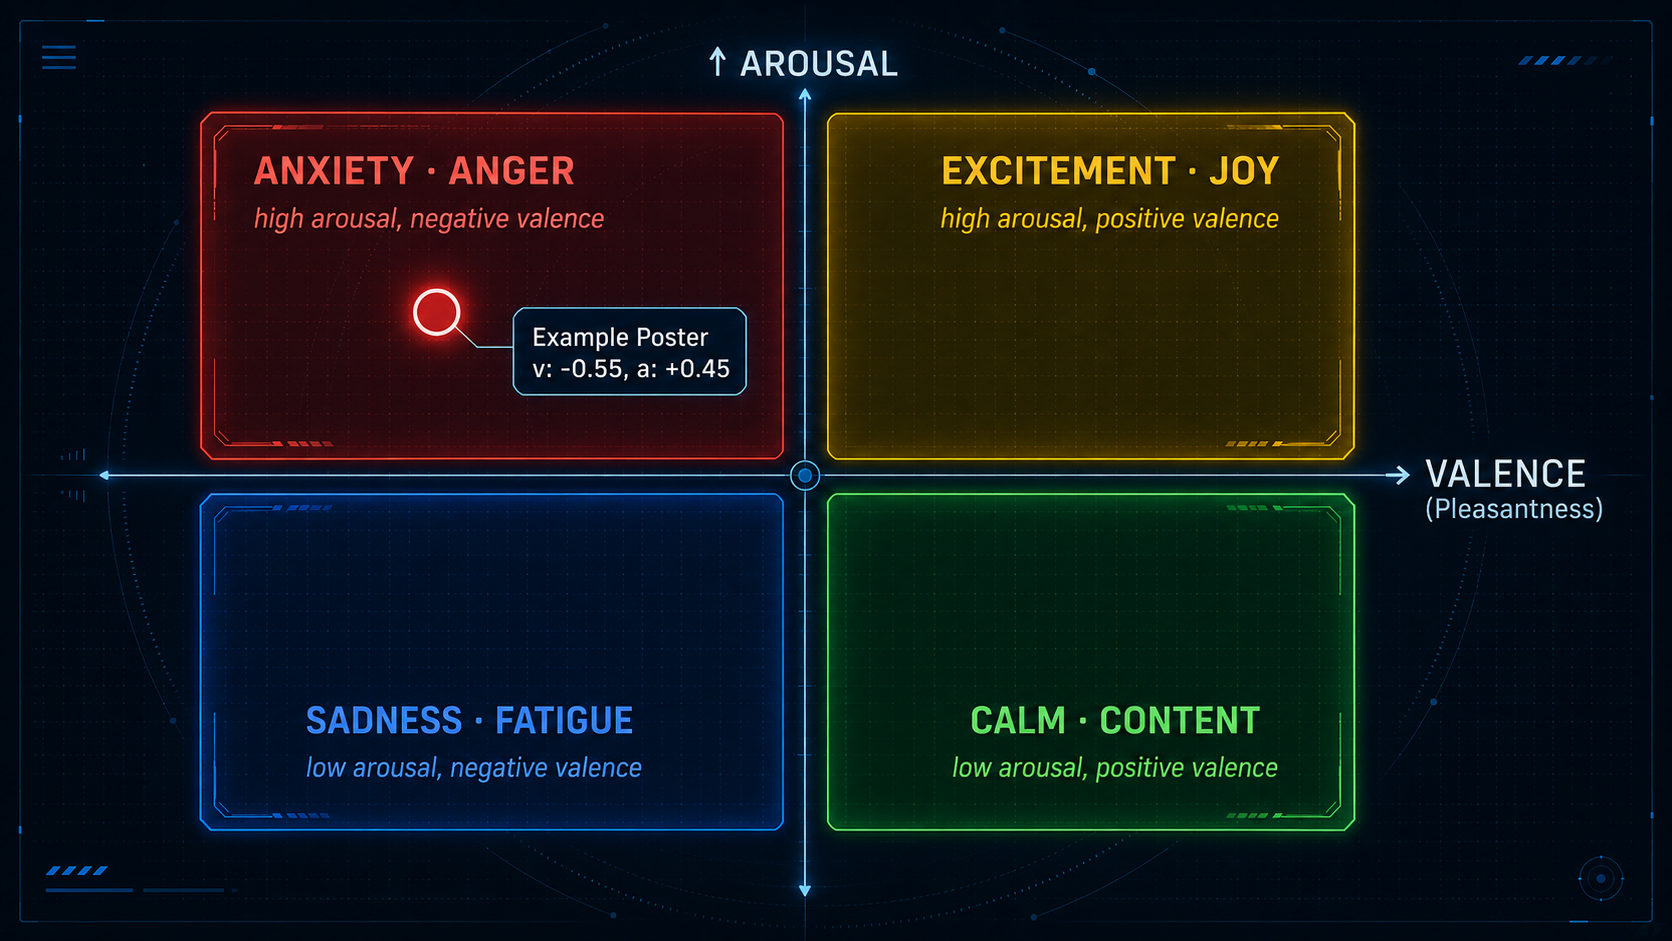
For example, a war poster often targets the area of unpleasant and simultaneously activating emotions, i.e., the space of anxiety, anger, or mobilization. A poster with a heroized leader may, on the other hand, target the area of positive activation, such as enthusiasm, pride, or joy. Material depicting a devastated country and starving children is likely to shift towards anxiety, sadness, anger, or helplessness.
Plutchik's circular map and Russell's two-dimensional map complement each other. The first model helps name specific basic and compound emotions, while the second shows their overall orientation according to pleasantness or unpleasantness and level of activation. Together they provide a more accurate picture of the emotional strategy of the analyzed visual.
Level of Manipulation
In addition to emotional analysis, Visual Insights also evaluates the overall level of manipulation. This is a synthetic assessment that combines several layers of analysis: the intensity of evoked emotions, the number and type of rhetorical or manipulative techniques used, and the overall strength of the material's persuasive effect.
A four-level manipulation indicator shows the overall level of manipulative influence. The arrow shows where the current analysis falls. A high value does not automatically mean that the material is lying; it primarily indicates the strength of the persuasive apparatus.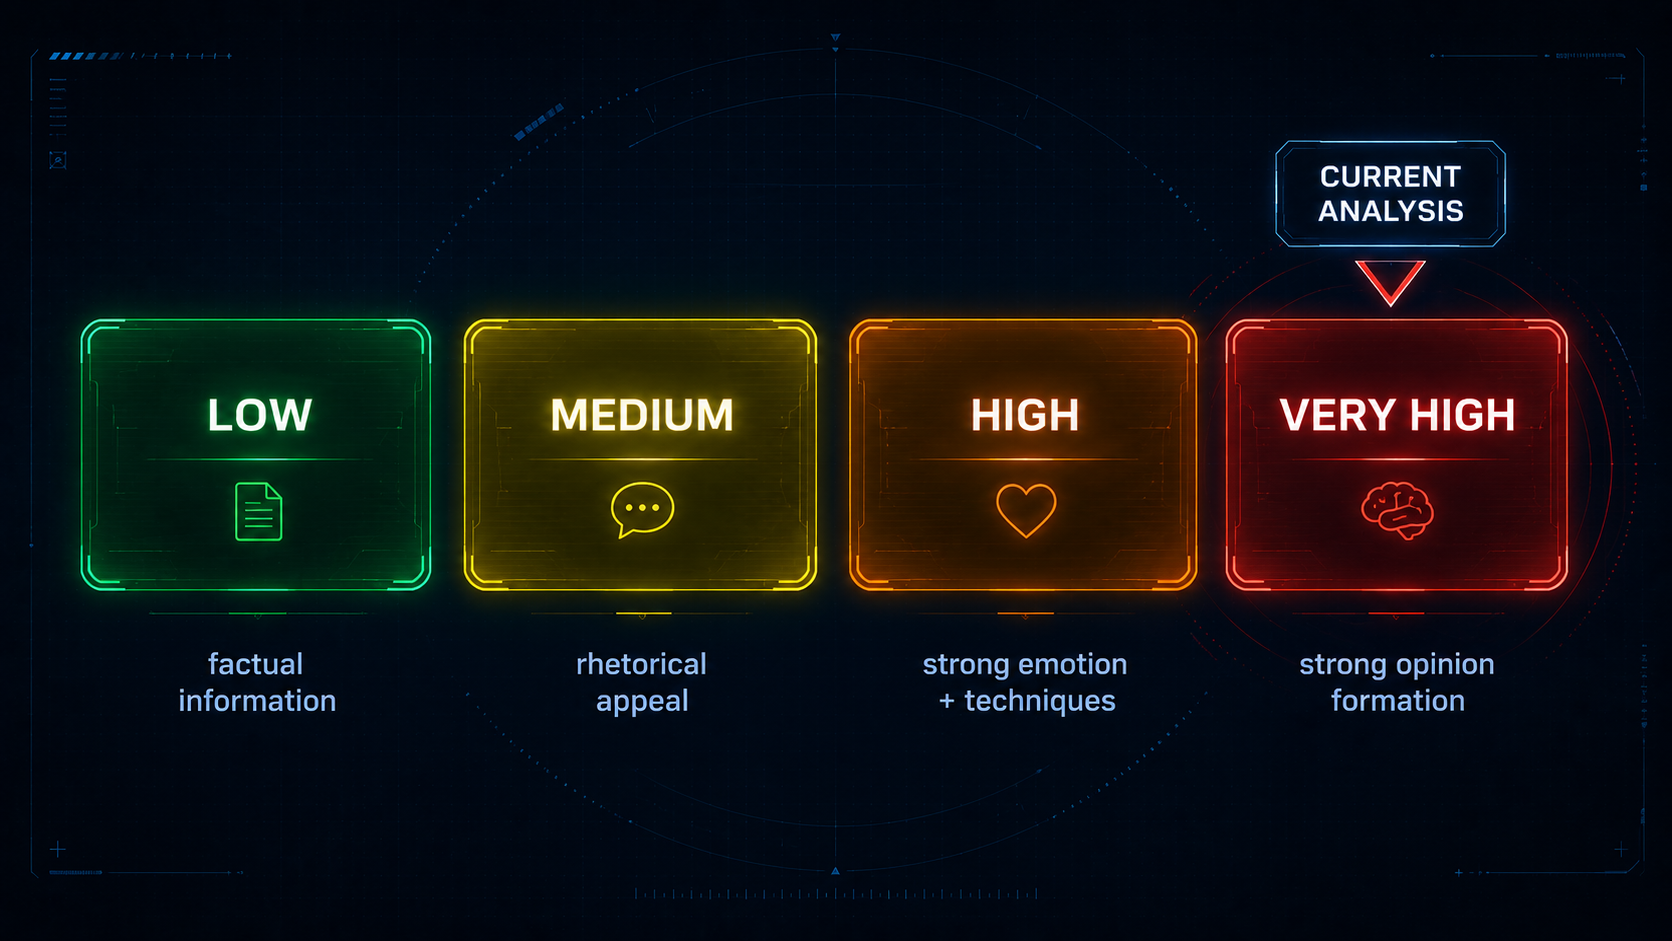
The level of manipulation therefore does not measure the truthfulness of the content. It measures the intensity of the means by which the material tries to influence interpretation, emotions, or audience reaction.
OCR — How We Extract Text from Images?
Many visual materials contain a significant part of the message directly in the text. Therefore, one of the first steps of the analysis is its automatic recognition using OCR (Optical Character Recognition) technology.
FactNinja uses multimodal models capable of working with both image and language simultaneously for text recognition. These systems can handle not only standard printed fonts but also stylized typography, handwritten elements, photographed text taken at an angle, or text captured in low quality, such as on mobile screenshots.
Verbatim Extraction
The basic principle of our OCR is fidelity to the original source. We transcribe the text exactly as it appears in the image — without correcting typos, without adding missing words, and without language adjustments.
If outdated spelling, unusual punctuation, or even a printing error is used on the poster, it will also be preserved in the OCR output. This approach is intentional. We perceive OCR primarily as a way of documenting the source, not as an editorial transcription.
Such details can be important, for example, when dating materials, determining their origin, or verifying authenticity. For historians, journalists, researchers, and fact-checkers, seemingly minor language deviations can represent valuable clues.
Automatic Translation
If the recognized text is in a different language than the one you use in the application interface, FactNinja can display both the original wording and its translation.
We always keep the original text available because it represents the primary source of information and preserves the forensic value of the material. The translation serves as an auxiliary tool for understanding the content and facilitates work for users who do not speak the language.
Thanks to the combination of OCR, language detection, and automatic translation, it is possible to analyze materials originating from different language and cultural environments without the need to use external translation tools.
AI Detection — Was the Image Created by Artificial Intelligence?
With the increasing availability of generative artificial intelligence, it is important to distinguish whether the analyzed image likely captures a real scene or whether it may have been artificially created. In the context of propaganda, disinformation, and political communication, this is crucial information: a photograph of a real event has different evidential value than an image generated by artificial intelligence, even if they appear similar at first glance.
To detect AI-generated content, we use the external service Sightengine, which returns the probability that the image was created or modified using generative artificial intelligence. The result is given in percentages and serves as a guideline, not as definitive proof.
The system evaluates typical signs of generative models, such as unusual image artifacts, irregularities in object structure, problematic details in faces, hands, text, or background, and other visual patterns that appear more frequently in synthetically created images than in regular photographs.
It is important to emphasize that AI detection is not infallible. High-quality generated images can appear very authentic, while real photographs may contain signs similar to AI artifacts due to compression, filters, edits, or low quality. Therefore, the result of AI detection is always understood as one of the contextual signals that must be read together with other layers of analysis.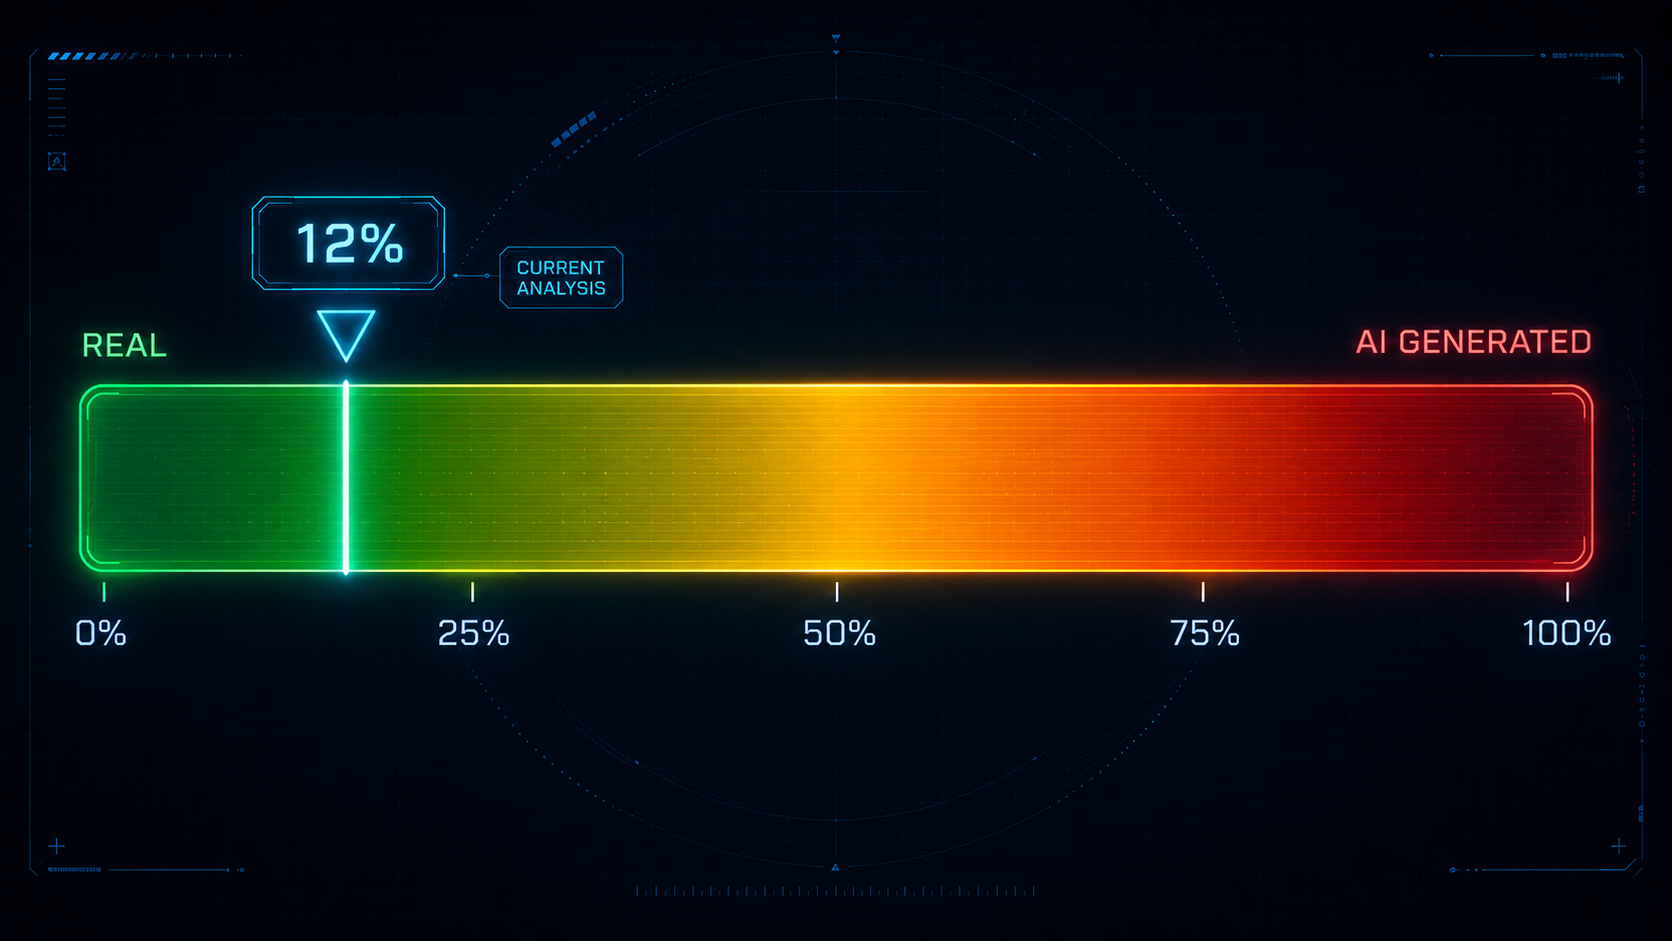
It is important to know what AI detection cannot do. Photo-realistic generations of the latest models sometimes slip through with low probability. Edited real photographs (Photoshop, deepfakes based on real footage) may not be captured by detection. And overall, a 70% AI probability does not mean "definitely AI" — it means "AI signal is strong, but human judgment is necessary". The score is a tool to focus your attention, not an automatic verdict.
Multilingualism — Analysis Available Across Languages
FactNinja supports six languages: Czech, English, Slovak, Polish, German, and Spanish. Analysis texts and comments are automatically translated between these languages in the background. If an author creates an analysis, for example, in Czech, the system automatically makes it available in other supported languages as well.
Users can thus read the content in the language that matches their settings or preferences. A Czech analysis of a Russian propaganda poster can thus become understandable to English, Slovak, Polish, German, or Spanish audiences without the author having to create multiple language versions manually.
Tool Limits — What FactNinja Does Not Do
To work with the results correctly, it is important to clearly state what cannot be expected from FactNinja. Uncritical trust in AI tools can lead to wrong conclusions. Properly set expectations, on the other hand, make them useful analytical assistants.
We Do Not Evaluate "Truth" as a Whole
FactNinja does not conclude the analysis with a simple verdict like "true" or "false". Visual material may contain true statements set in a manipulative framework, false statements presented in a neutral tone, or symbolic messages where the question of truth does not make simple sense.
Visual Insights describe the emotional and persuasive impact of the material. Augmented data helps identify specific verifiable claims. The overall judgment, however, remains with the user.
We Do Not Capture Everything
AI systems can make mistakes. Sometimes they attribute a meaning to the material that is not there, other times they overlook an important detail, cultural reference, or local context. Therefore, personal judgment, comparison with other sources, and consultation with experts in important cases are always necessary.
FactNinja helps speed up, clarify, and structure the analysis. However, it does not replace human critical thinking.
We Are Not a Substitute for Journalistic or Expert Work
The analysis of propaganda or suspicious visuals does not end with FactNinja. Reverse image search can help determine where the material comes from. Archival databases can show when the image first appeared. Consultations with historians, regional experts, or fact-checkers can supplement the context that AI itself may not know.
FactNinja is a starting point. Further work remains human.
Scientific Foundations
FactNinja is based on several verified theories from the fields of psychology of emotions, media studies, rhetoric, and propaganda analysis.
Emotions and Propaganda
The basis of emotional analysis includes the work of Robert Plutchik, who formulated the psychoevolutionary theory of emotions and the model of eight basic emotions in 1980. An important basis is also Russell's circumplex model of emotions, which describes emotions using two dimensions: valence and activation. The broader debate on universal emotions is also followed by Paul Ekman's work on basic emotions across cultures.
Rhetorical and Manipulative Techniques
In describing persuasive mechanisms, we build on classic works in the field of psychology of persuasion and argumentation. Robert B. Cialdini described the principles of social influence, such as authority, reciprocity, social proof, or scarcity. Steven A. McCornack formulated the theory of information manipulation, which shows that manipulation can be done not only by lying but also by omission, ambiguity, or shifting relevance. Douglas Walton systematically processed the area of informal logic and argumentative fallacies.
Visual Propaganda and Media
For propaganda analysis, we also build on classic and contemporary works in media studies. Jacques Ellul is among the key authors of modern propaganda theory. A more contemporary framework is offered, for example, by the work of Jowett and O'Donnell, who describe propaganda as a systematic attempt to influence the attitudes, perceptions, and behavior of the audience.
How to Read the Analysis Critically — Three Rules
1. Visual Insights Describe Intent, Not Truth
A high degree of fear, anger, or anxiety may mean that the material works with an alarming appeal. Such an appeal may be justified, for example, as a warning against a real threat, or abused if it creates artificial panic. Visual Insights show the emotional strategy of the material; the correct interpretation is determined by the broader context.
2. Manipulation Is Not the Same as Lying
A high level of manipulation means that the material strongly shapes the interpretation, emotions, or reaction of the audience. However, it does not automatically mean that it contains falsehood. A well-prepared public benefit campaign can be highly persuasive and still factually correct. Conversely, a calmly formulated text may contain a false statement.
We therefore understand manipulation as the degree of persuasive influence, not as an automatic label of something bad.
3. More Perspectives Lead to Better Judgment
A single visual material can be analyzed from multiple perspectives. Assistant analyses, Visual Insights, OCR, translations, augmented data, AI content detection, or reverse image search form individual layers of a broader puzzle.
None of these layers is the final word. The purpose of FactNinja is to provide tools, transparently describe the methodology, and offer scientifically based foundations. The final interpretation remains with the user.
— The FactNinja Team